What is LLM inference cost? A practical guide for AI engineering teams

Taran Srivastava
Senior Product Manager
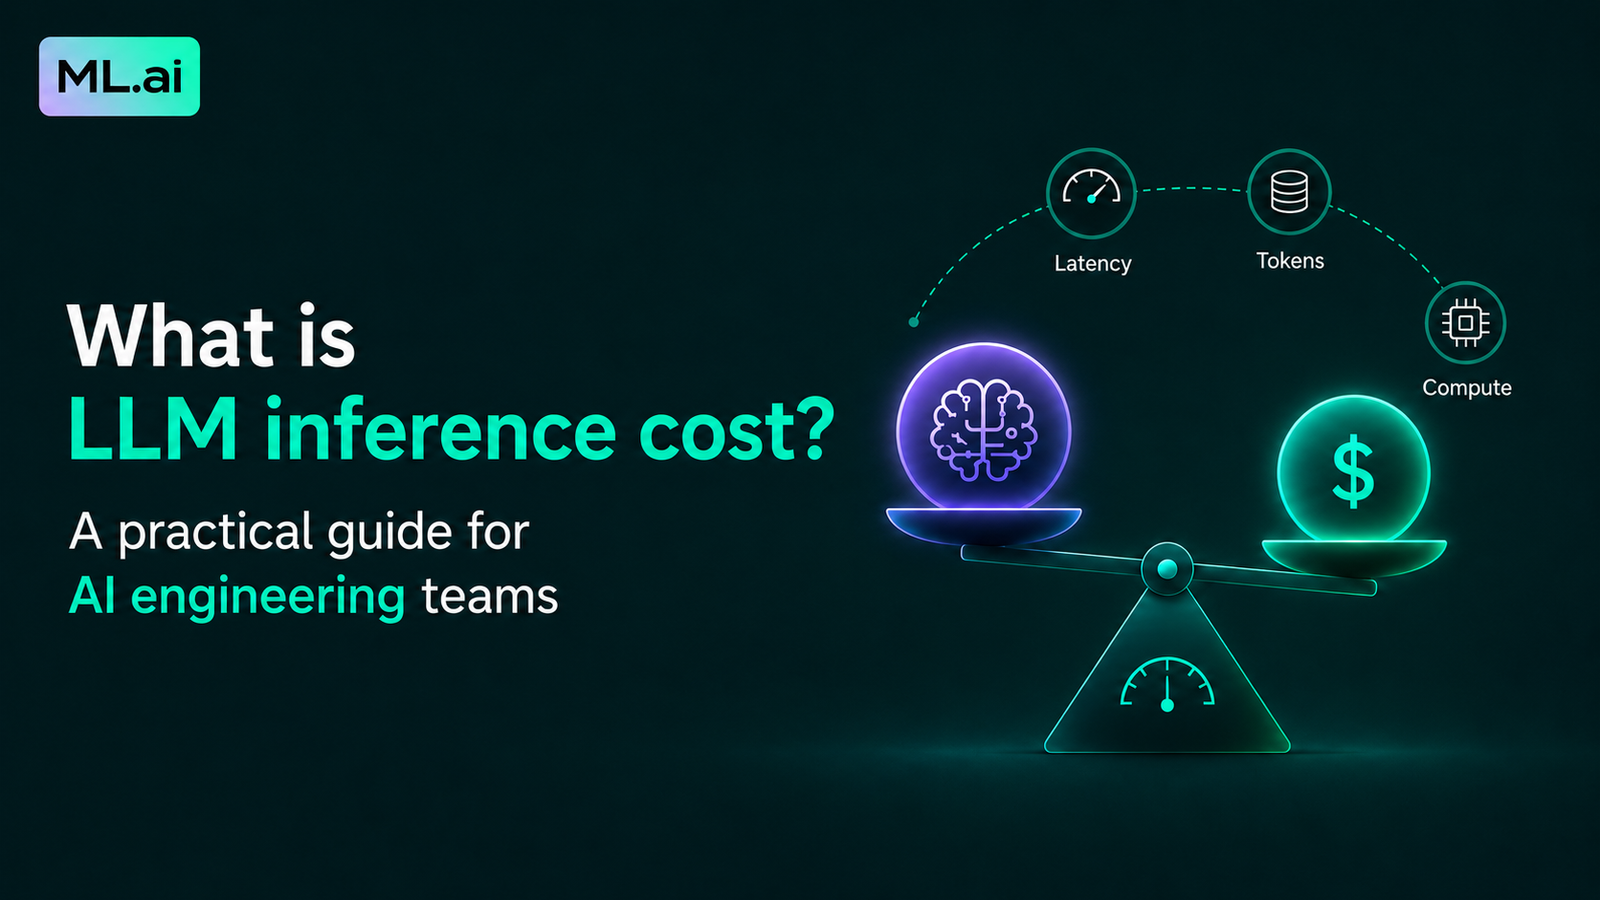
LLM inference cost is what you pay each time a model reads a prompt and generates a response, billed per million tokens and split across four line items: uncached input, cache writes, cache reads, and output.
If you build with coding agents, the line item that matters is not the one most guides discuss. In 28 days of production telemetry from a single developer working on a monorepo, cache reads accounted for 86.5% of the bill, and generated output accounted for 5.7%. The whole bill came to $8,785.21, and $8,276.39 of it went on re-reading context the model had already seen.
That number comes from a July 2026 case study by Sheng-Wei Peng, Yi-Hsun Lin, and Yi-Pei Lee, Inference Economics of Enterprise Coding Agents, which logged 31,901 requests across two contiguous 28-day periods on a production repository. It is the closest thing the field has to a published bill rather than a published price sheet.
This blog covers what the meter measures, why agentic workloads bend the cost curve upward faster than the work grows, what caching does to the math, and which levers move the number in what order. Every figure carries a link. Where the data doesn't exist, that is stated rather than filled in.
What is LLM inference cost, and what is the meter counting?
Inference is the model doing its job at runtime. Training is a one-time capital event; inference is an operating expense that scales with usage, and for any product that succeeds, cumulative inference spend passes cumulative training spend and never comes back.
The meter is the token. But "per million tokens" hides three different things happening on the hardware, and those three things are why the price sheet has four columns instead of one.
Prefill and decode are different machines
Every request runs in two phases, and they hit different bottlenecks.
Prefill processes your entire input at once to produce the first output token. Because the full input is known upfront, this is a matrix-matrix operation that parallelises well and, as NVIDIA's inference optimization guide puts it, "effectively saturates GPU utilization." Prefill is compute-bound.
Decode generates output tokens one at a time, each conditioned on every token before it. That is a matrix-vector operation, and NVIDIA is blunt about where the time goes: "The speed at which the data (weights, keys, values, activations) is transferred to the GPU from memory dominates the latency, not how fast the computation actually happens." Decode is memory-bandwidth-bound.
Christin Pohl, a solution engineer working on AI infrastructure at Microsoft, drew the same line in her PyTorch Conference talk in April 2026: time to first token is "heavily compute-bound because we have to calculate the whole KV values and the attention scores," while inter-token latency is "memory-bound, we're reading the whole pre-calculated values."
This asymmetry is the entire reason output tokens cost roughly five times input tokens on every major price sheet. You aren't paying for tokens. You are paying for two different kinds of GPU scarcity, and the token is the billing proxy.
The KV cache is the thing that makes decode survivable
During decode, each new token needs the key and value tensors of every previous token. Recomputing them at every step would be ruinous, so they are held in GPU memory as the KV cache. NVIDIA gives the sizing formula:
KV cache size per token (bytes) = 2 × num_layers × (num_heads × dim_head) × precision_in_bytes
Total KV cache = batch_size × sequence_length × 2 × num_layers × hidden_size × sizeof(FP16)
For a Llama 2 7B model at 16-bit precision with a batch size of 1, that comes to roughly 2 GB. The cache grows linearly with both batch size and sequence length, which is why long-context serving is memory-constrained rather than compute-constrained, and why so much serving research (paged attention, cache offloading, quantised KV) is about fitting more of it in less space.
You do not manage this directly when you call an API. You pay for it indirectly, in the price of long inputs.
The token is not a stable unit of account
Here is a detail almost nobody accounts for when comparing models. Anthropic's own pricing documentation states that Claude 4.7 and later models use a newer tokenizer that "produces approximately 30% more tokens for the same text."
So a $5.00 per million rate on one model generation and a $5.00 rate on the next are not the same price for the same work. The same file, the same diff, the same system prompt gets chopped into roughly 30% more billable units. A model can get cheaper on the price sheet and more expensive on your invoice at the same time.
One vendor is not the exception here. A developer on Hacker News made the same observation about Gemini in April 2026, noting that a newer release "tokenizes images and PDF pages less efficiently by default (>2x token usage per image/page) so you end up paying much more" on top of the higher headline rate.
The practical rule: before you migrate a workload to a new model on the strength of its rate card, run a fixed corpus through both tokenizers and compare token counts, not prices.
Where does the money actually go in an AI coding workflow?
Almost nowhere in a chat product and almost everywhere in an agent loop. The distinction is worth understanding precisely, because the optimisations that work for one are close to useless for the other.
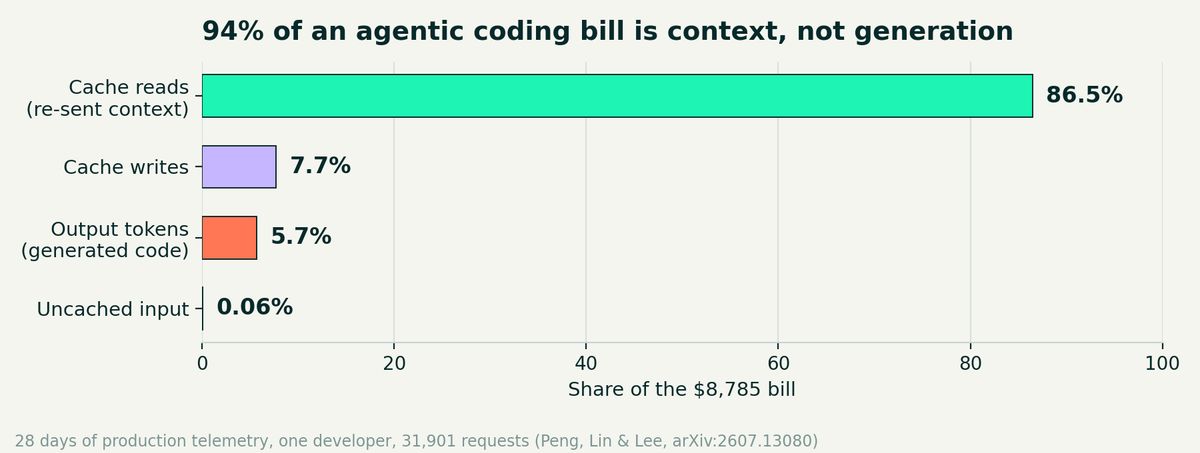
In 28 days of production coding-agent telemetry, 94.2% of the bill was context being sent to the model, not code being generated by it. Source: arXiv:2607.13080, Table XI.
The ratio that reframes the problem
Across those 31,901 requests, the telemetry recorded 15.31 billion input-side tokens against 20.16 million output tokens. That averages to roughly 480,000 prompt tokens and 632 output tokens per request: a ratio of about 760 input tokens for every output token.
Set that against the price sheet. Claude Opus 5 charges $5.00 per million input and $25.00 per million output, so output looks five times more expensive. At a 760:1 volume ratio, the input side still dominates the bill by a factor of 152 before any caching is applied.
Pohl named this workload shape directly in her talk, listing "pre-fill heavy workloads like agentic coding, where you have to look into long input sequences" as a case that warrants separating prefill and decode onto different GPU pools entirely.
Practitioners see the same thing from the billing side. One Hacker News commenter put it like this in July 2026: "In agentic coding, cached input tokens is 90% of the API cost."

Another, summarising a benchmark study, noted that "input tokens, not output, become the dominant cost driver" precisely because every round feeds the whole run history back into the model.
The four line items, and what each one means
| Line item | What triggers it | Opus 5 rate | Share of the measured bill |
|---|---|---|---|
| Uncached input | Prompt content with no cache hit | $5.00 / M | 0.06% |
| Cache write | First time a prefix is stored (5-minute TTL) | $6.25 / M | 7.7% |
| Cache read | A stored prefix is reused | $0.50 / M | 86.5% |
| Output | Tokens the model generates, including reasoning | $25.00 / M | 5.7% |
Two things follow from that table that are easy to miss.
Cache writes cost more than uncached input: A write is billed at 1.25x the base input rate for a 5-minute TTL and 2x for a 1-hour TTL. A cache that is written and never read is strictly worse than no cache at all. ProjectDiscovery's engineering team ran into exactly this: on a busy platform, a cold start every five minutes turns a large share of requests into writes, and in their words, "cache writes cost more than standard input tokens."
Reasoning tokens bill as output: Higher reasoning effort settings do not add a separate charge; they extend the decode phase. On the measured workload, the frontier configuration generated 20.2 million output tokens versus 5.06 million for the comparison model at comparable code volume, a 4x gap the authors attribute to "extensive reasoning traces and repeated full-file rewrites" rather than to more code being produced.
Hence the case for a per-message reasoning control rather than one global setting. Reasoning effort tuning is a per-turn spend decision, not a quality dial you set once, and most turns in a coding session do not need the top of the range.
Why do agentic coding bills grow faster than the work does?
Because an agent loop re-sends its own history, input consumption grows with the square of the step count while output consumption grows linearly. This is the single most important mechanism in agentic cost, and it is not in any of the pages currently ranking for this term.
The arithmetic, stated once
ProjectDiscovery described the shape of it in their April 2026 engineering post, using their own security agent as the example: "Neo's average task runs 26 steps with 40 tool calls. System prompts are 2,500+ lines of YAML, over 20K tokens per agent. Each step re-sends the entire conversation: system prompt, tool definitions, and all prior messages... On a 40-step task, you're sending that 20K-token system prompt 40 times. And as the conversation grows linearly, step N re-sends everything from steps 1 through N-1."
Written out, for a task of N steps with a static prefix of P tokens and roughly t tokens added per step:
Input tokens billed = Σ (P + (i-1)·t) for i = 1..N = N·P + t · N(N-1)/2
Output tokens billed = N · (tokens generated per step)
The first term is linear in N. The second is quadratic. Output is linear. Beyond a modest number of steps, the quadratic term runs away with the bill.
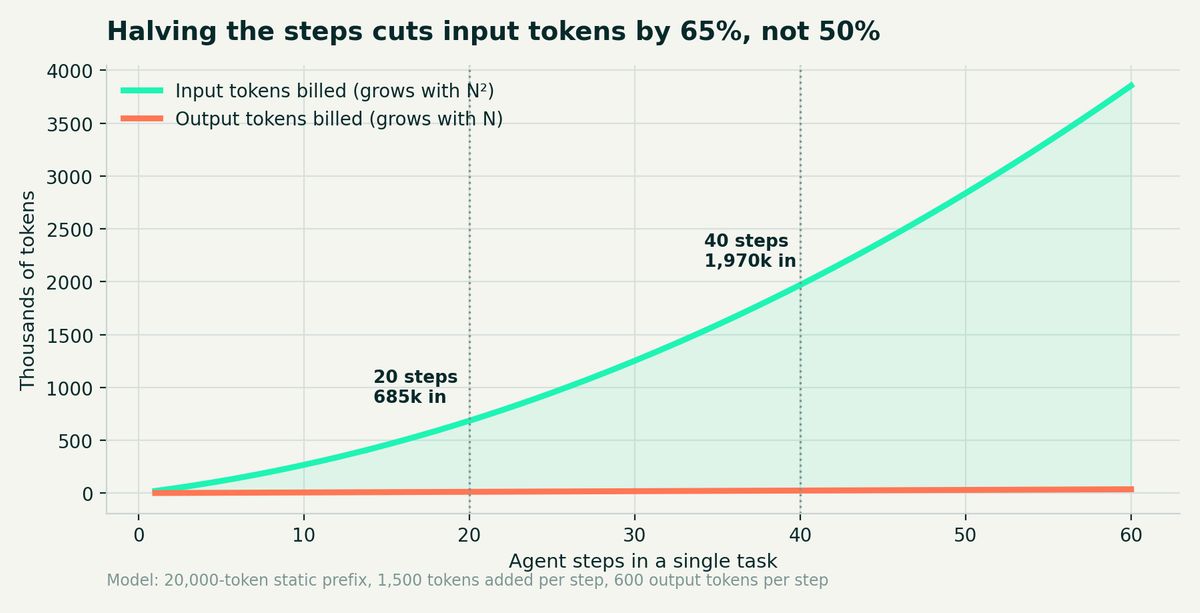
With a 20,000-token prefix, 1,500 tokens added per step and 600 output tokens per step, a 40-step task bills 1,970,000 input tokens against 24,000 output tokens: a ratio of 82 to 1.
What this changes about optimisation
Run the same model at 20 steps instead of 40, and input tokens fall from 1,970,000 to 685,000. A 50% cut in steps buys a 65% reduction in input tokens. Halving output verbosity, by contrast, saves 50% of a line item that was 5.7% of the measured bill: under three percentage points.
Ranked by what the arithmetic says:
Most cost advice published on this topic addresses item 4 and stops. The reason item 1 gets ignored is that it is not a billing setting. It is an agent design decision: how the work is planned, how much of the repository the agent has to explore before it can act, and how many times it has to redo something it got wrong.
Agent planning behavior is therefore a cost feature, not only a quality feature. A planning mode that produces the order of work before any file is touched converts an expensive exploratory loop into a short one, and the saving compounds against N².
In ML.ai Code, Plan mode investigates and writes a plan with the edit and write tools switched off, and the Architect agent returns the order of work, the files involved, and the trade-offs it weighed without changing anything. Approving a plan for four targeted edits costs a fraction of letting an agent discover those same four edits across thirty steps.
The same logic explains why delegation is a cost mechanism. When a read-only search agent runs a bounded turn and returns a result, the search output never enters the parent conversation's prefix, so it is not re-sent on every subsequent step. ML.ai Code's Explore agent works this way, and General, Architect, and Plan cannot modify code at all, which caps what a delegated turn can cost you in repair work later.
What does prompt caching actually do to the bill?
It converts the dominant line item into a tenth of itself, and it is the only lever with published before-and-after numbers from a production system.
Prompt caching stores the KV cache for a static prefix server-side. When the next request starts with the same prefix, the model skips prefill for that portion and reads the cached state instead. You are billed for the read rather than the compute.
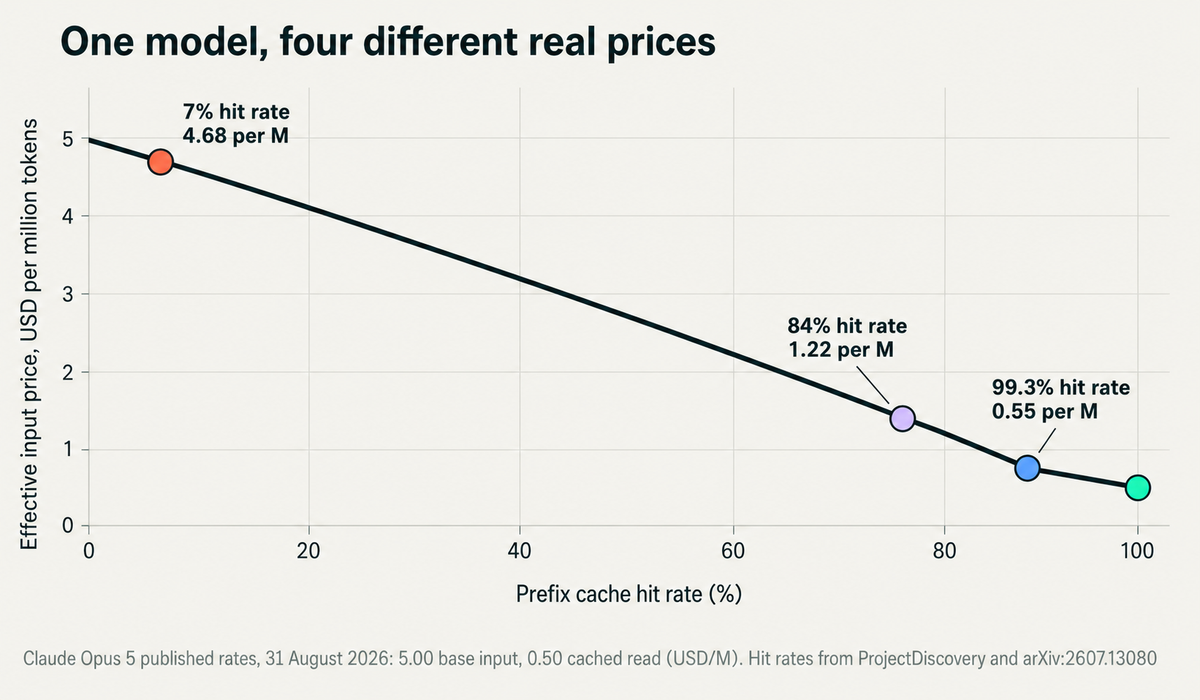
The same model is priced anywhere between $4.68 and $0.53 per million input tokens depending purely on how you package what you send.
The documented case: 7% to 84%
ProjectDiscovery published the full before-and-after in April 2026. Their cache hit rate was sitting at 7% because dynamic per-user values were being rendered into the system prompt, invalidating the cacheable prefix on nearly every request.
Moving that dynamic content to the tail of the message took them to 74% in a single deployment, in their words, jumping "from under 8% to 74% overnight." Further work on breakpoint placement and TTLs took them to 84%, cutting LLM spend by 59% overall, 66% post-optimization and 70% across the final ten days, measured over 9.8 billion cached tokens.
Their architecture is worth copying because the constraints are documented rather than folklore:
The measured coding-agent telemetry reached 99.3%, which is higher because a single-developer session on one repository has an extremely stable prefix. At that hit rate, caching cut realized spend by 88.6%: the same token volume would have cost $77,059 at nominal input rates and came to $8,785.21 instead.
The counterintuitive result
At 99.3% cached reads, the frontier API's effective price landed at $0.573 per million processed tokens, which is below the $2.83 per million amortized cost of the shared on-premises GPU slice the authors compared it against, and well below the $11.87 of a dedicated reservation. The API's total bill was still larger, but only because that configuration processed 16.9 times more tokens. Per token processed, the cached hosted model was cheaper than self-hosting.
None of this is a law of nature. It is a utilization effect, and the authors say so plainly: the on-premises per-token figure "divides a time-billed resource by one developer's token volume, so it is inflated by low single-tenant utilization."
It does still invert the assumption that self-hosting is automatically the cheap option, which is a reason to measure before you provision. Pohl's version of the same advice: "the honest default is most enterprise customers out there probably shouldn't" self-host, with the exceptions being that inference is your business, you need zero-day model access, or you have compliance requirements that rule out an external endpoint.
What actually breaks caching
Four things, all of them self-inflicted and all of them fixable:
If you are running an agent and have never checked your hit rate, that is the first number to pull. The gap between 7% and 84% is a 59% swing in spend on identical traffic.
How do the three major vendors price the same thing differently?
They have converged on the discount and diverged on almost everything else. Rates below are the published figures as of 31 August 2026 and change often; check the source before you build a forecast on them.
| Anthropic (Opus 5) | OpenAI (gpt-5.6-sol) | Google (Gemini 2.5 Pro) | |
|---|---|---|---|
| Base input | $5.00 / M | $4.00 / M | $1.25 / M (≤200k) |
| Cached read | $0.50 / M | $0.40 / M | $0.125 / M |
| Cache read discount | 10x | 10x | 10x |
| Cache write | $6.25 / M (5m), $10.00 / M (1h) | $5.00 / M | No write charge |
| Cache storage | None | None | $4.50 / M per hour |
| Output | $25.00 / M | $20.00 / M | $10.00 / M |
| Long-context handling | Full 1M window at standard rates | Rates double above the short-context threshold | Rates double above 200k |
| Batch discount | 50% both directions | ~50% | 50% |
Three things in that table are worth acting on.
The 10x cached-read discount is now universal: All three vendors price a cache hit at exactly one tenth of base input. Any architecture that assumes caching is a vendor-specific optimization is out of date.
Cache billing models are not interchangeable: Anthropic charges a premium to write and nothing to hold. Google charges nothing to write and $4.50 per million tokens per hour to hold. A prefix that sits warm for eight hours a day costs nothing extra on Anthropic and $36 per million tokens per day on Google. Porting a caching strategy between providers without re-doing the arithmetic will surprise you.
Long-context pricing is where the largest hidden cliff sits: OpenAI's gpt-5.6 family doubles every rate above its short-context threshold: input goes from $4.00 to $8.00, output from $20.00 to $30.00. Gemini 2.5 Pro doubles above 200k. Anthropic states that Claude 4.6 and later include the full 1M window at standard pricing, so "a 900k-token request is billed at the same per-token rate as a 9k-token request."
For an agent whose conversation crosses a threshold mid-task, that is a step change in unit price partway through a job. None of the eight pages currently ranking for this keyword mentions it.
There is one more overhead that is documented and never budgeted: tool use adds a system prompt of its own. Anthropic publishes the exact counts, and they move between model versions in ways nobody would predict. Opus 4.7 costs 675 tokens for tool use with auto tool choice; Opus 4.8 costs 290; Opus 5 costs 286. All of it sits on top of your own tool schemas, on every request, re-sent every step.
Reducing that per-turn payload is a real, if modest, lever. ML.ai Code's experimental code mode has the model call tools by writing a short program rather than receiving every tool schema on every request, cutting roughly 1,700 tokens per turn. On the 40-step task modeled above, that is 68,000 tokens, about 3.5% of the input. Worth taking, but not worth confusing with the step-count lever that is twenty times larger.
Why is "just use a cheaper model" not the free lever it looks like?
Because the cheaper model's tokens are cheaper and its mistakes are not, and the mistakes are paid for in engineering hours rather than API credits.
The coding-agent study ran both configurations against the same monorepo with the same developer across two contiguous 28-day periods, which is about as controlled as production evidence gets. Gross code churn was comparable. Defect burden was not.
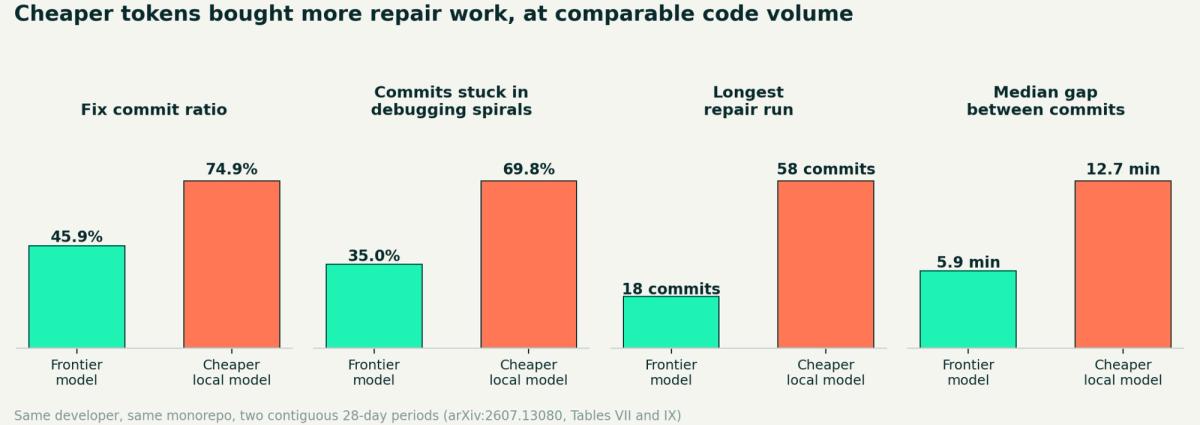
Every workload indicator worsened under the cheaper configuration, with the repair-loop measures degrading most. Source: arXiv:2607.13080, Table IX.
The fix commit ratio, the share of non-merge commits that repair earlier work, ran at 45.9% for the frontier configuration and 74.9% for the cheaper local one. Within every difficulty tier, the odds of a commit being a repair were 2.6 to 4.9 times higher, with a Mantel-Haenszel odds ratio of 3.61.
The behavioural indicators moved with it. Commits caught in debugging spirals of three or more consecutive repairs went from 35.0% to 69.8%, the longest uninterrupted repair run went from 18 commits to 58, and median time between commits went from 5.9 minutes to 12.7.
The authors then replayed 613 real commits through four routing policies to test whether a hybrid gateway could get the savings without the defects. It could not. Their finding: "no routing policy that sends any tier to the local model can match the pure-API defect profile." Sending only the hardest tier to the frontier model saved 26.3% of true total cost of ownership; sending high and medium tiers locally saved 13.4% but delivered a fix commit ratio nine points worse. Routing traces a cost-quality frontier rather than finding a free optimum.
Two caveats belong here: This is a single-developer, non-randomized case study, so it establishes a pattern rather than a population effect. And the gap is not about context capacity: both models supported the same 1M-token context class. The failures concentrated in "hallucinated import paths, stale method signatures, migration-revision collisions" and similar repository-specific grounding, which is precisely the kind of knowledge a benchmark score does not capture.
The correct reading is not "never route." It is Pohl's version: pick a model that is "just smart enough, and not a tiny, tiny bit smarter. Just smart enough." Then stop trying to buy savings by lowering the quality of the reasoning, and start buying them by sending fewer tokens through whatever model you settled on. The difference between those two moves is the difference between reducing spend and deferring it into your engineers' afternoons.
Her cheapest suggestion is also the most overlooked: hardcode the trivial intents. "You would be surprised to see the amount of requests just being like hi, help, what can you do. Those top 20, hardcode the answer. You don't need your LLM for that. You don't need to waste tokens."
Which levers actually move the number, and in what order?
Ranked by measured effect on the dominant line items, with the evidence for each.
| Lever | Mechanism | Measured effect | Evidence |
|---|---|---|---|
| Raise the prefix cache hit rate | Prefix served from KV cache at 10% of input rate | 59% to 70% spend reduction (7% to 84% hit rate); 88.6% at 99.3% | ProjectDiscovery, arXiv:2607.13080 |
| Cut steps per task | Input tokens scale with N², output with N | 50% fewer steps gives 65% fewer input tokens | Derived; parameters from ProjectDiscovery's published agent profile |
| Shrink the re-sent prefix | Prefix is billed once per step | Linear in step count, multiplies against every turn | ProjectDiscovery: 20K-token system prompt sent 40 times |
| Set a 1-hour TTL on shared static prefixes | Prevents cold starts converting reads into writes | Part of the 74% to 84% improvement | ProjectDiscovery |
| Right-size the model | Fewer active parameters per token | Roughly 50% on model choices alone, per Pohl | PyTorch Conference, April 2026 |
| Batch anything not interactive | Async scheduling fills idle GPU capacity | 50% off both directions | Anthropic, OpenAI, Google price sheets |
| Tune reasoning effort per turn | Reasoning tokens bill as output | Output was 5.7% of the measured bill | arXiv:2607.13080, Table XI |
| Reduce tool schema payload | Schemas re-sent every request | ~1,700 tokens per turn (ML.ai code mode) | ML.ai Code documentation |
| Hardcode trivial intents | The request never reaches a model | 100% of the requests it removes | Pohl, PyTorch Conference |
Batching deserves a note. It is the highest-ratio saving on this list and it is unavailable to interactive coding, because the whole point of an interactive agent is that you are waiting. Batch your evals, your bulk refactors, your documentation generation and your regression sweeps. Do not expect it to help your inner loop.
How do you measure this in your own stack?
Nobody publishes the number you actually need, which is your own. Four measurements, in order, none of which takes more than 4-5 hours.
1. Split your spend into the four line items
Pull input_tokens, cache_creation_input_tokens, cache_read_input_tokens, and output_tokens per request and multiply each by its own rate. A single aggregate figure hides this completely and will point you to output tokens. If your breakdown resembles the published one, cache reads are the largest bar by an order of magnitude.
2. Compute your cache hit rate
hit rate = cache_read_input_tokens / (cache_read + cache_creation + input_tokens)Below 50% means dynamic content is sitting in front of your static prefix. Between 50% and 80% usually means TTLs are expiring between requests. Above 80% means the structure is right and the remaining work is on step count.
3. Compute input tokens per output token, per workload
Chat products land in the low tens. The measured coding agent came in at 760. Whichever end you are on tells you which half of the price sheet to care about, and it will differ between features inside the same product. Track it per workload, not per account.
4. Track steps per completed task
Here is the quadratic term, and it is the one number that will never appear on an invoice. Log the step count for every agent run and watch the distribution rather than the mean. A long tail of 60-step runs will dominate your bill even if the median is 12, because those runs cost roughly 25 times a 12-step run rather than 5 times.
Then set alerts on the ratios rather than the total. A bill that grows because you shipped a feature is fine. A bill that grows because your hit rate quietly fell from 84% to 40% after someone added a timestamp to a system prompt is not, and the total will not tell you which one happened.
Building that discipline into an agent by hand is work. The alternative is picking tooling where the controls already exist.
ML.ai Code exposes the ones that matter as first-class settings: Plan and Architect modes for cutting steps before they happen, per-message reasoning effort from low through max, read-only Explore delegation that keeps search output out of the parent context, memory so project context established once is not re-sent every session, and hard attachment bounds of 50 KB, 2,000 lines and 2,000 characters per line so a stray file cannot silently inflate a prefix. It is free on the VS Code Marketplace and installs into Cursor on a compatible version.
Conclusion
You now have the four line items, the reason input dominates output in agent loops by roughly 760 to 1, the quadratic relationship that makes step count the strongest lever available, and a ranked list of what each fix is worth.
Start with the cache hit rate. It takes one query against your usage logs; it needs no architectural change to measure, and it tells you within an hour whether you're paying $0.53 or $4.68 per million input tokens for the same model doing the same work. If the number is low, the fix is usually moving one dynamic field out of a system prompt.
Then look at step counts, because that is where the compounding lives. If your agent is exploring a repository from scratch on every task, or redoing work it got wrong the first time, no caching strategy will catch up with the token volume that generates. Tooling that plans before it edits and delegates search to bounded read-only turns attacks the term that grows fastest. ML.ai Code is built around exactly that trade: same model, same output quality, fewer tokens to get there.
Frequently Asked Questions
Why are output tokens more expensive than input tokens?
Because prefill and decode hit different hardware limits. Prefill processes your whole input in parallel and saturates the GPU's compute, while decode generates one token at a time and is bound by memory bandwidth, so it cannot be parallelised the same way. The roughly 5:1 price ratio across vendors reflects that difference in achievable throughput, not a difference in the tokens themselves.
Does prompt caching change the model's output?
No. The cache stores the key-value tensors for a prefix the model has already processed, so it skips recomputation rather than approximating it. The result is identical to an uncached request with the same prompt. What changes is latency (documented reductions of up to 85%) and price (a 10x discount on the cached portion across all three major vendors).
Is self-hosting cheaper than paying per token?
Not automatically, and the published comparison points the other way for a single-tenant workload. In the 28-day coding-agent study, a cached frontier API landed at $0.57 per million processed tokens against $2.83 for a shared on-premise slice and $11.87 for a dedicated reservation. On-premise still saved 40.1% of total cost of ownership under shared allocation, so total spend and utilization are the numbers to model, not per-token rates. Self-hosting wins on volume, data residency, and zero-day model access, not on the price sheet alone.
How do reasoning or thinking tokens get billed?
As output, at the output rate, whether or not you see them. Raising the reasoning effort extends the decode phase and therefore the bill. On the workload measured above, output was 5.7% of total spend, so this is a real but secondary lever for agentic coding. For short-prompt, long-answer workloads such as analysis or generation, the ratio flips and reasoning effort becomes one of the largest levers you have.
Why is my bill rising when per-token prices keep falling?
Because unit price and consumption are moving in opposite directions and consumption is winning. Epoch AI's analysis of inference price trends found prices for equivalent capability falling between 9x and 900x per year with a median around 50x, and a16z's LLMflation piece put the figure at roughly 10x annually. Meanwhile, a single agent task can consume two million input tokens, whereas a chat turn consumes two thousand. Cheaper tokens times far more tokens is a larger bill.
What cache hit rate should an agentic workload achieve?
Above 80% is achievable with deliberate breakpoint placement, and single-repository sessions with a stable prefix have been measured above 99%. Below 50% almost always means dynamic content sits ahead of your static prefix. The published path from 7% to 74% was a single change: moving per-user values out of the system prompt and appending them at the tail of the request.
Written by
Taran Srivastava
Senior Product Manager